When on-time delivery performance starts declining, the cause is not always obvious. A transportation team might blame carrier delays, even when the underlying problem involves changing shipment volumes, warehouse congestion, or unrealistic delivery commitments.
Transportation data analytics helps shippers move beyond assumptions by examining actual shipment activity. Instead of relying on disconnected tracking updates and spreadsheets, businesses can analyze transportation data to identify patterns, measure performance, and make better operational decisions.
For growing freight teams, the objective is straightforward: understand what changed, determine why it happened, and identify practical improvements.
What Is Transportation Data Analytics?
Transportation data analytics is the process of collecting, organizing, and analyzing transportation information to improve operational visibility and decision-making.
In freight management, this includes shipment tracking events, carrier performance, transportation costs, transit times, and delivery exceptions.
Transportation analytics transforms these records into information that logistics teams can use to evaluate service quality and identify recurring problems.
For example, a shipper might discover that delayed deliveries consistently involve a particular receiving facility rather than a specific carrier.
By connecting individual shipment records with broader performance trends, data analytics helps businesses distinguish isolated disruptions from larger operational issues.
Effective transportation management depends on accurate information, consistent measurement, and clear responsibility for corrective action.
Start by Defining On-Time Delivery
Before investigating declining performance, logistics teams must agree on what qualifies as an on-time shipment.
Some businesses measure delivery against a promised date, while others use a scheduled appointment window or carrier service commitment.
These differences can produce conflicting performance reports.
Compare Planned and Actual Delivery
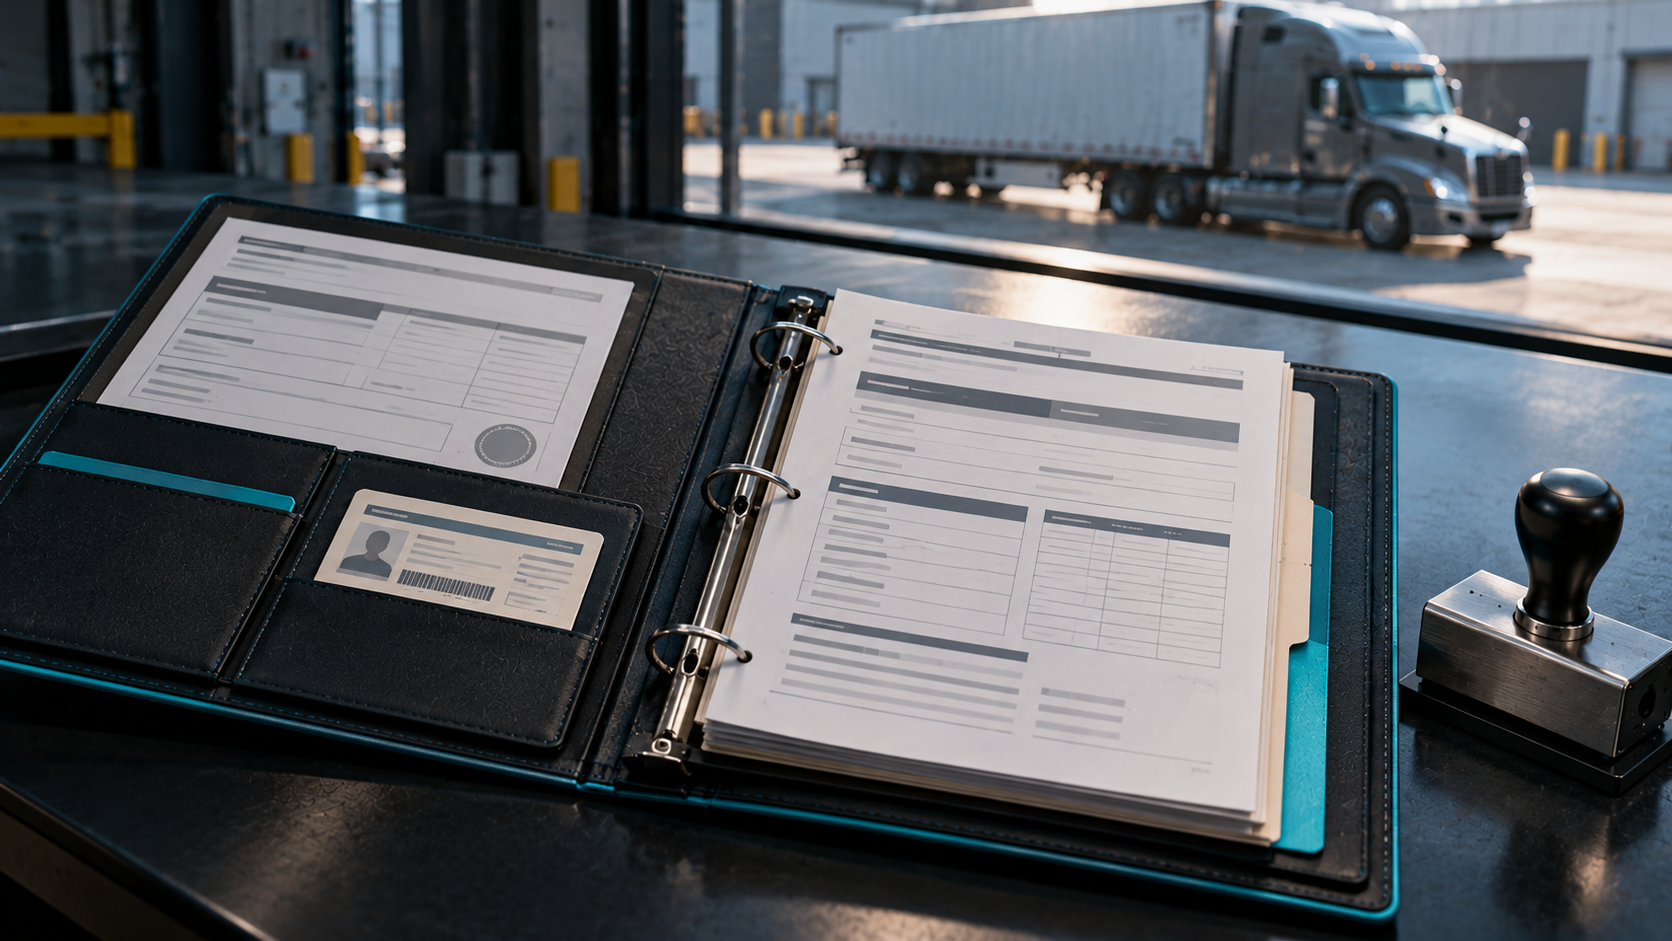
Transportation data should include both the original delivery commitment and the actual arrival timestamp.
If an appointment changes, preserve the original and revised dates rather than overwriting the shipment history.
Verify Tracking Milestones
A delayed proof-of-delivery upload does not necessarily mean the truck arrived late.
Teams should distinguish confirmed arrival events from estimated status updates.
Our freight tracking software guide explains why reliable milestone information matters when managing shipment exceptions.
Consistent definitions make transportation analytics more useful across carriers, facilities, and reporting periods.
Use Data Analysis to Identify Delivery Problems
When on-time performance declines, the first step is to examine comparable shipment groups.
Analyze transportation data by carrier, lane, transportation mode, origin, destination, and customer requirements.
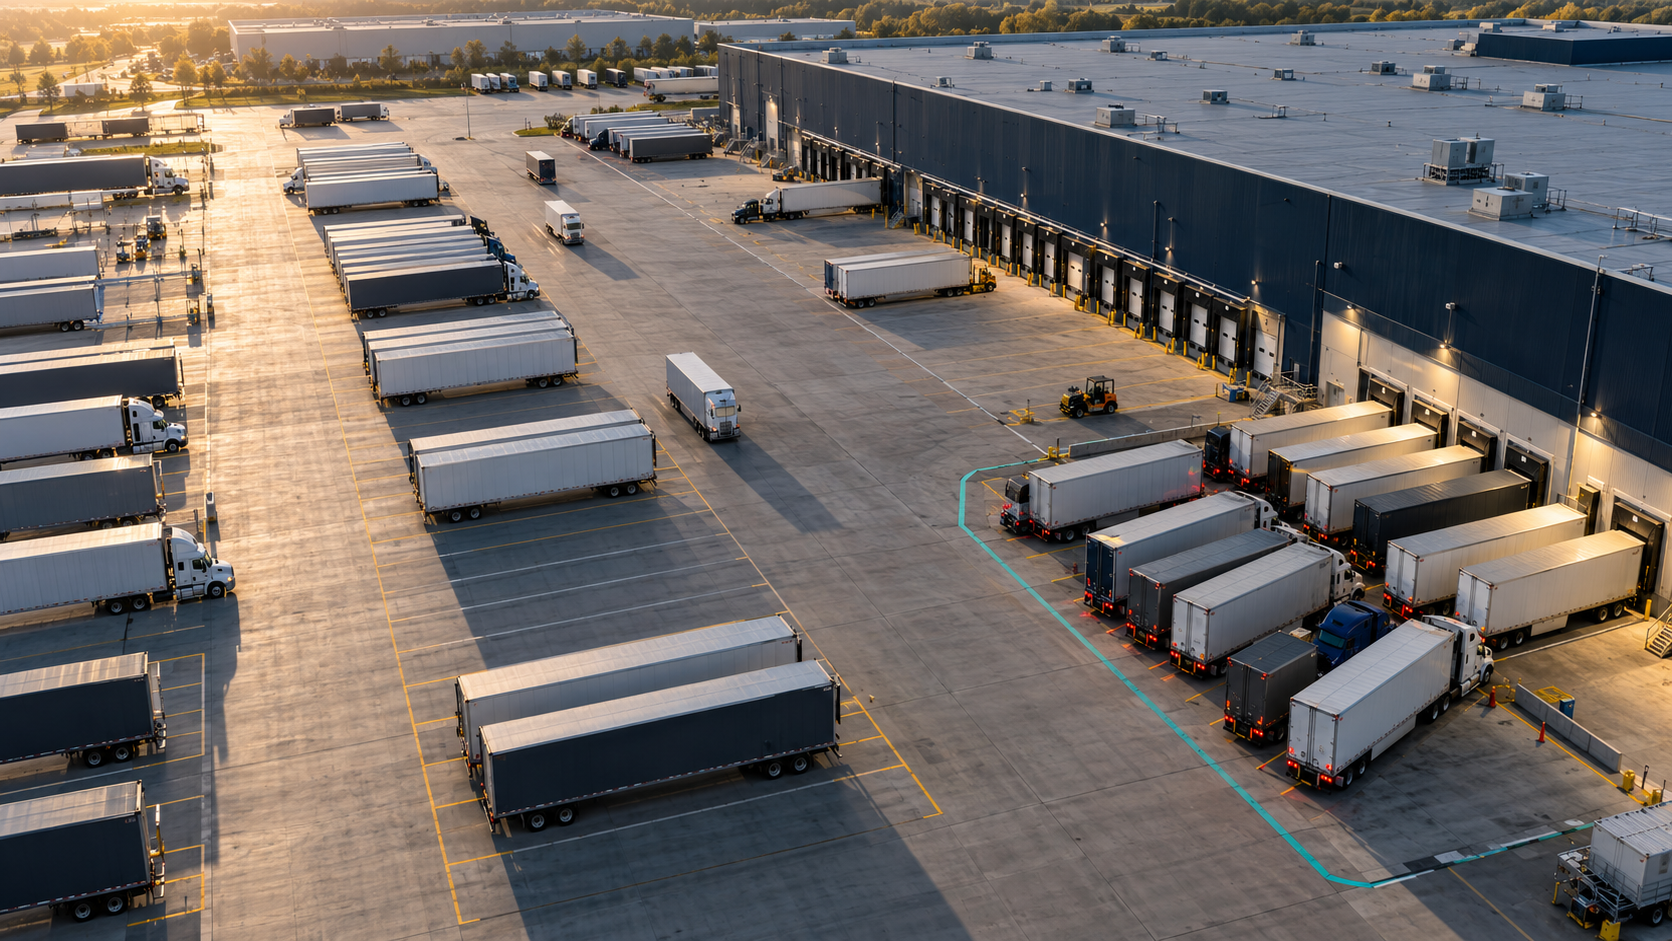
A company shipping more freight into congested markets may experience a lower overall delivery percentage even when individual carrier performance remains stable.
This is why aggregate metrics can be misleading.
Examine Carrier Performance
Compare on-time pickup, transit time, delivery reliability, and exception frequency across similar shipments.
Avoid evaluating carriers based on a small sample or fundamentally different service requirements.
Review Facility Performance
Warehouse delays, limited appointment availability, and extended loading times can affect delivery performance.
Transportation analytics should distinguish facility-related issues from carrier transportation delays.
Compare LTL and FTL Operations
Less-than-truckload shipments often involve terminal handoffs, while full truckload shipments generally follow different execution workflows.
Separating these transportation modes produces more meaningful performance comparisons.
The goal is to identify the actual source of variation before implementing changes.
Descriptive, Diagnostic, and Predictive Analytics
Different types of data analytics answer different operational questions.
Descriptive Analytics: What Happened?
Descriptive analytics summarizes historical transportation performance.
Dashboards may display on-time delivery rates, shipment volume, freight spend, and recurring exceptions.
These metrics establish a baseline for further investigation.
Diagnostic Analytics: Why Did It Happen?
Diagnostic analytics examines underlying causes.
For example, comparing warehouse dwell times with missed delivery appointments may reveal that delays begin before shipments leave the origin facility.
Predictive Analytics: What Might Happen Next?
Predictive analytics uses historical transportation data and current information to estimate potential outcomes.
Machine learning and predictive models can identify patterns that support estimated arrival times or exception detection.
However, predictive analytics depends on reliable data collection and appropriate model validation. An estimated arrival remains a prediction, not a confirmed event.
Our AI transportation management system guide explains how shippers can evaluate practical AI capabilities without relying on unsupported automation claims.
How Big Data Supports Transportation Planning
As freight networks grow, businesses generate larger amounts of operational information.
Big data analytics can help organizations examine shipment volumes, seasonal changes, transportation costs, and long-term service trends.
For example, demand forecasts may help logistics teams anticipate periods of increased shipping activity.
Historical travel time information can also provide context when evaluating realistic delivery commitments.
Advanced analytics can support resource allocation, warehouse scheduling, and transportation planning by revealing recurring patterns.
However, larger datasets are not automatically more valuable.
Reliable data sharing, consistent shipment identifiers, and accurate timestamps often matter more than the volume of information collected.
The Bureau of Transportation Statistics Freight Analysis Framework provides broader context on freight movement across the United States.
For individual shipping decisions, internal transportation records remain essential.
Transportation Analytics vs. Traffic Management Analytics
Transportation data analytics serves several industries, but their objectives differ.
Public transportation agencies may use an intelligent transportation system to study traffic patterns, travel behavior, and infrastructure performance.
Traffic engineers may analyze geographic information system (GIS) data to understand roadway conditions, delivery routes, and congestion.
Some transportation technologies also support route planning, route optimization, or predictive maintenance for vehicle fleets.
These applications differ from shipper-side freight intelligence.
Shipper teams use freight analytics to compare carrier performance, monitor shipment progress, understand transportation costs, and decide which delivery exceptions need attention.
The Federal Highway Administration's freight resources provide useful background on transportation infrastructure and freight operations.
Understanding these distinctions helps shippers evaluate technology based on actual business requirements rather than unrelated features.
Turn Transportation Data Into Actionable Insights
The purpose of transportation data analytics is not to generate more reports. It is to support better decisions.
When analysis identifies a recurring delivery issue, transportation teams should establish an improvement plan with clear ownership.
For example, if freight regularly experiences delays at one distribution center, the business might review appointment scheduling, loading capacity, and communication practices.
If problems occur across several carriers on the same lane, teams should investigate shipment requirements and delivery commitments before assuming carrier performance is responsible.
Each improvement initiative should include a measurable baseline, an accountable owner, and a follow-up review.
Data science can support complex analysis, but operational teams still need to interpret findings and decide how to respond.
Build Transportation Dashboards That Support Decisions
Effective dashboards should make transportation performance easy to understand without hiding important context.
A useful dashboard might display delivery performance, exception frequency, carrier reliability, and transportation spending.
However, percentages should always be considered alongside shipment volume.
A carrier handling five shipments should not be evaluated exactly like one managing several hundred.
Power BI and other reporting tools can help visualize transportation data, while a transportation management system (TMS) can connect analytics to actual shipment activity.
Our freight operations software guide explains why connected execution records are important for daily freight management.
Good dashboards allow teams to investigate individual shipments rather than relying exclusively on summary metrics.
How Freight Intelligence Supports Better Decisions
Traditional transportation reporting often focuses on historical performance.
Modern freight intelligence connects those insights with shipment visibility, exception management, and operational workflows.
This approach can help businesses make informed decisions without switching between multiple disconnected systems.
Lighthouse, our shipper-facing platform, is designed around visibility, analytics, security, and automation.
By bringing transportation information into a connected environment, Lighthouse supports more organized freight operations and informed decision-making.
For broader sustainability analysis, the EPA SmartWay program offers resources for understanding freight transportation efficiency.
The value of transportation analytics comes from connecting reliable information to practical action.
Investigate One Delivery Performance Problem
Choose a carrier, lane, or facility with declining on-time delivery and compare similar shipments using consistent milestone definitions. Assign an owner to the likely cause, record a corrective action, and set a date to review the result.
FAQ
Q: What is transportation data analytics?
A: Transportation data analytics involves collecting and analyzing shipment, carrier, and operational information to understand performance, identify problems, and support better transportation decisions.
Q: How can transportation analytics improve on-time delivery?
A: By examining shipment milestones, carrier performance, facility delays, and historical transit times, businesses can identify recurring problems and implement targeted improvements.
Q: What is the difference between descriptive and predictive analytics?
A: Descriptive analytics explains historical performance, while predictive analytics estimates potential future outcomes using data patterns and statistical models.
Q: What transportation KPIs should shippers track?
A: Important metrics include on-time pickup and delivery, shipment exceptions, transit time, carrier performance, freight costs, and tracking data completeness.
Q: Can a TMS support transportation data analytics?
A: Yes. A transportation management system can organize shipment information and support reporting, visibility, and performance analysis. Available capabilities depend on the platform.
Related Resources:
See your freight in a new light.
Lighthouse gives logistics teams live shipment visibility, carrier signals, and exception alerts, without the manual work.
Request Access